State diagrams are a powerful tool in modeling the dynamic behavior of systems. They provide a visual representation of states, transitions, events, and actions within a system, making it easier to understand how a system behaves in response to various inputs. This tutorial will walk you through the key elements of a state diagram using an example.
What is a State Diagram?
A state diagram, also known as a state machine diagram, illustrates the states of an object and how it transitions from one state to another based on events and conditions. It is widely used in software engineering to model the behavior of complex systems.

Key Components of a State Diagram
- States: Represent different conditions or situations in which an object can exist.
- Transitions: Arrows that connect states, indicating how the system moves from one state to another.
- Events: Triggers that cause a transition between states.
- Actions: Activities that occur as a result of a transition.
Example State Diagram Breakdown
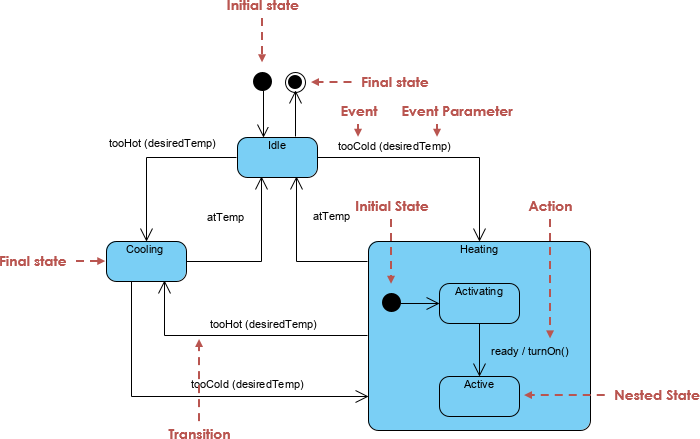
Let’s analyze the provided state diagram, which models a temperature control system. The states and transitions are as follows:
Initial and Final States
- Initial State: The starting point of the state diagram, represented by a filled black circle.
- Final State: Indicates the completion of a process, represented by a circle with a surrounding ring.
States and Transitions
- Idle:
- This is the primary state of the system when it’s not actively heating or cooling.
- Transitions:
- Moves to Cooling if the temperature is too hot.
- Moves to Heating if the temperature is too cold.
- Cooling:
- This state represents the system actively cooling down the environment.
- Transitions:
- Returns to Idle when the temperature reaches the desired level (atTemp).
- Heating:
- This state indicates that the system is heating the environment.
- Substates:
- Activating: The system is preparing to heat.
- Active: The system is actively heating.
- Transitions:
- Moves to Idle when the desired temperature is reached (atTemp).
Nested States
- Heating contains nested states, which adds complexity to the diagram.
- Initial State within Heating: The system starts in the Activating state when the heating process begins.
- Action: The system is ready to turn on or is currently active.
Event Parameters
- The diagram specifies event parameters such as
desiredTemp, indicating the target temperature for the system. Transitions occur based on comparisons between the current temperature and this desired value.
How to Create a State Diagram
Creating a state diagram involves several steps:
Step 1: Identify States
Determine the various states your system can be in. For our temperature control system, the states are Idle, Cooling, and Heating.
Step 2: Define Events
List the events that trigger transitions between states. For example, temperature changes can trigger state transitions.
Step 3: Map Transitions
Draw arrows to represent the transitions between states. Clearly label each transition with the corresponding event that causes it.
Step 4: Add Actions and Parameters
Include any actions that occur during transitions and specify any event parameters that influence these transitions.
Step 5: Review and Refine
Ensure that your state diagram accurately represents the behavior of the system. Make adjustments as necessary based on feedback or further analysis.
Conclusion
State diagrams are invaluable tools for modeling the behavior of systems. They provide clarity on how systems respond to various events, making them easier to understand and implement. By following the steps outlined in this tutorial, you can create effective state diagrams that accurately represent the dynamic behavior of your systems. Whether you’re working on software design, hardware systems, or real-world processes, mastering state diagrams will enhance your modeling capabilities.
State Diagram Resources
- State Machine Diagram Tutorial – Visual Paradigm: This tutorial provides a comprehensive guide on creating state machine diagrams, including the basic components, transitions, and states.
- Mastering State Diagrams in UML: A Comprehensive Guide: This article covers the fundamentals of state diagrams, their components, and best practices. It also includes advanced concepts and common mistakes to avoid.
- How to Draw State Machine Diagram? – Visual Paradigm: This guide walks you through the steps to create a UML state machine diagram in Visual Paradigm, from selecting the diagram type to adding states and transitions.
These resources should give you a solid foundation in creating state diagrams with Visual Paradigm.
