A UML Deployment Diagram is a type of structural diagram that shows the physical deployment of artifacts (software components) on nodes (hardware devices). It models the runtime configuration of hardware and software components in a system, making it especially useful for understanding distributed systems.
In this tutorial, we will walk through the components of a UML Deployment Diagram based on the image provided and explain how to create such a diagram.

1. Understanding UML Deployment Diagram Components
Before diving into the details, let’s break down the key elements represented in the provided diagram:
a. Nodes (Devices)
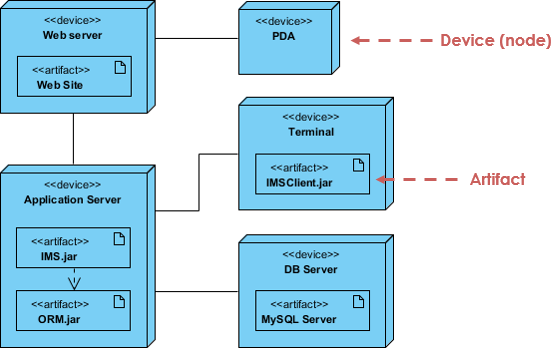
- Nodes are physical or virtual devices on which the system’s components (artifacts) are deployed. They are represented as 3D boxes.
- In the diagram:
- The devices include
Web server,Application Server,DB Server,PDA, andTerminal. - These nodes represent physical devices or servers that host different parts of the system.
- The devices include
b. Artifacts
- Artifacts are the physical files or executables that reside on the nodes. They can be application files, JAR files, databases, configuration files, etc.
- Artifacts are represented by a document icon inside the node.
- In the diagram:
- The
Web Siteartifact is deployed on theWeb server. - The
IMS.jarandORM.jarfiles are deployed on theApplication Server. - The
IMSClient.jaris deployed on theTerminal. - The
MySQL Serveris deployed on theDB Server.
- The
c. Relationships between Nodes
- Nodes are connected via associations, indicating communication between these nodes.
- In the diagram:
- There are connections between all devices, showing that the
Web server,Application Server,DB Server,Terminal, andPDAare interconnected in some way.
- There are connections between all devices, showing that the
2. Step-by-Step Guide to Create a UML Deployment Diagram Using Visual Paradigm
Step 1: Launch Visual Paradigm and Create a New Diagram
- Open Visual Paradigm.
- Create a new project.
- Select Diagram from the toolbar and choose Deployment Diagram from the list of UML diagrams.
Step 2: Add Nodes (Devices)
- Use the Node tool from the toolbox to add nodes (devices) to your diagram.
- For each device, drag a 3D box onto the canvas and name it based on your system’s architecture.
- In this case, add the following nodes:
Web serverPDAApplication ServerDB ServerTerminal
Step 3: Add Artifacts to the Nodes
- Use the Artifact tool to add artifacts inside each node, representing the software components deployed on the devices.
- Artifacts are typically represented as document icons inside the nodes.
- In the diagram:
- The
Web servernode contains theWeb Siteartifact. - The
Application Servercontains two artifacts:IMS.jarandORM.jar. - The
DB Servercontains theMySQL Serverartifact. - The
Terminalcontains theIMSClient.jarartifact. - The
PDAdoes not have any specific artifact in the example diagram.
- The
Step 4: Connect the Nodes
- Use the Association tool to connect the nodes, showing communication or interaction between them.
- In the diagram, the
Web server,Application Server,DB Server,PDA, andTerminalare all connected, indicating that they are part of a distributed system that communicates with each other.
Step 5: Add Stereotypes to Nodes
- Stereotypes can be added to indicate the type of node or device.
- In the diagram:
- Each node has the stereotype
<<device>>, indicating that it is a physical or virtual device.
- Each node has the stereotype
Step 6: Add Deployment Descriptions (Optional)
- You can include deployment descriptions or notes for each node, explaining the purpose of each device and artifact.
- For example, you can add a note explaining that the
Web serverhosts the front-end of the application, while theApplication Serverhandles business logic.
3. Detailed Explanation of the Components in the Diagram
Let’s review the components in the example diagram to fully understand how they work together.
a. Web Server
- Node:
<<device>> Web server - Artifact: The
Web Siteartifact represents the web application hosted on theWeb server. This could be the front-end of the system, handling user interactions and HTTP requests.
b. Application Server
- Node:
<<device>> Application Server - Artifacts:
IMS.jar: This could represent a core business logic module of the system.ORM.jar: This artifact might represent a component responsible for object-relational mapping, translating data between a relational database and the object-oriented application.
- The arrow between
IMS.jarandORM.jarindicates a dependency, meaning thatIMS.jarrelies onORM.jarto function properly.
c. DB Server
- Node:
<<device>> DB Server - Artifact:
MySQL Serverrepresents the database service running on theDB Server, used to store and manage data.
d. Terminal
- Node:
<<device>> Terminal - Artifact:
IMSClient.jarcould represent a client-side application running on the terminal, which interacts with the main system.
e. PDA
- Node:
<<device>> PDA - The
PDAin the diagram represents a mobile or handheld device that is part of the system’s infrastructure. It connects to the system but doesn’t have an artifact associated in this diagram.
4. Key Points to Remember
- Nodes (Devices): Represent physical or virtual hardware elements (e.g., servers, terminals, mobile devices). These host the deployed artifacts (software components).
- Artifacts: Represent the deployed software components or files (e.g.,
.jar,.exe, databases) that reside on the nodes. - Communication Links: Represent relationships between nodes, showing how different parts of the system communicate or interact with each other.
- Stereotypes: Use
<<device>>to indicate that the node is a physical or virtual device. Other stereotypes can be used for different purposes (e.g.,<<artifact>>,<<execution environment>>). - Dependency: Artifacts can have dependencies on each other, which means one artifact requires another to function properly (e.g.,
IMS.jardepends onORM.jar).
5. Best Practices
- Clarity: Ensure that all devices and artifacts are clearly labeled and the relationships between them are straightforward.
- Granularity: Only model the devices and artifacts that are essential to understanding the system’s deployment. Avoid unnecessary details.
- Consistency: Use consistent notation for nodes, artifacts, and relationships to avoid confusion.
6. Conclusion
A UML Deployment Diagram provides a clear, visual representation of how a system’s software is deployed on its hardware. It is especially useful in distributed systems, where understanding the interactions between different devices and components is critical. By following this tutorial and using tools like Visual Paradigm, you can create comprehensive deployment diagrams to model your system’s architecture.
This tutorial has walked you through the process of creating a UML Deployment Diagram, explaining the key elements such as nodes (devices), artifacts (software components), and their relationships. By practicing the steps outlined here, you can effectively model the deployment architecture of your own systems.
Official Visual Paradigm Resources
These resources should help you learn how to create UML diagrams, including Package Diagrams, using Visual Paradigm. They provide both theoretical insights and practical, step-by-step instructions.
- Visual Paradigm UML Tutorial
https://www.visual-paradigm.com/tutorials/uml-tutorial/
This is Visual Paradigm’s official tutorial page, offering a comprehensive guide to creating various UML diagrams, including package diagrams. - What is a UML Package Diagram?
https://www.visual-paradigm.com/guide/uml-unified-modeling-language/what-is-package-diagram/
A detailed guide on UML Package Diagrams, explaining how they are used to organize system components and their relationships, with examples created in Visual Paradigm. - Visual Paradigm Community Forum
https://forums.visual-paradigm.com/
The official Visual Paradigm forum is where users discuss UML diagram creation, including package diagrams. You can ask questions and find tips from the community.
