UML (Unified Modeling Language) state diagrams are essential tools for modeling the dynamic behavior of systems by illustrating the different states an object can be in and the transitions between those states in response to events. State diagrams help in understanding how a system reacts to various inputs over time. In this article, we will learn about UML state diagrams using a practical example: a thermostat control system. We will also explore why Visual Paradigm is one of the best UML software tools for developers.
Understanding the Thermostat Control System
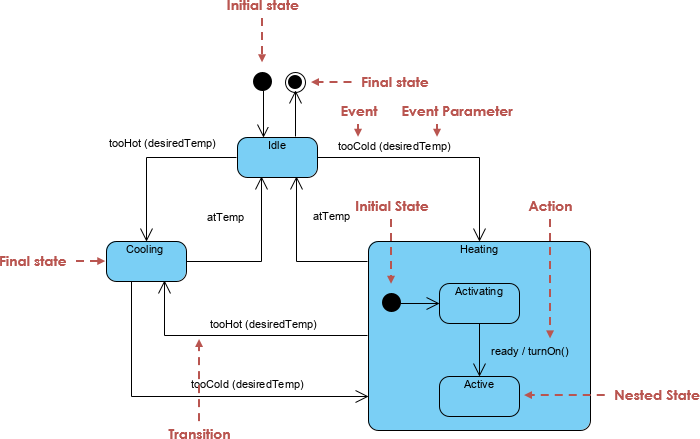
The Figure below illustrates a state diagram for a thermostat control system. Let’s break down the key elements and concepts depicted in this diagram.

Key Elements of a State Diagram
- State:
- Definition: Represents a condition or situation during the life of an object.
- Representation: A rounded rectangle with the state’s name.
- Example: States like “Idle,” “Cooling,” “Heating,” “Activating,” and “Active.”
- Initial State:
- Definition: Represents the start point of the state machine.
- Representation: A solid black circle.
- Example: The initial state at the beginning of the diagram.
- Final State:
- Definition: Represents the end point of the state machine.
- Representation: A solid black circle with a border.
- Example: The final states connected to the “Cooling” and “Heating” states.
- Transition:
- Definition: Represents a change from one state to another in response to an event.
- Representation: A solid arrow connecting states, often labeled with the event that triggers the transition.
- Example: The transition from “Idle” to “Cooling” triggered by the
tooHot(desiredTemp)event.
- Event:
- Definition: Represents an occurrence that can trigger a transition.
- Representation: Labels on the transition arrows.
- Example: Events like
tooHot(desiredTemp),tooCold(desiredTemp), andatTemp.
- Event Parameter:
- Definition: Represents additional information associated with an event.
- Representation: Parameters in parentheses following the event name.
- Example: The
desiredTempparameter in thetooHot(desiredTemp)andtooCold(desiredTemp)events.
- Action:
- Definition: Represents an operation performed during a transition.
- Representation: Labels on the transition arrows, often following a slash (
/). - Example: The
turnOn()action in the transition from “Activating” to “Active.”
- Nested State:
- Definition: Represents a state that contains substates, providing a way to model hierarchical states.
- Representation: A state containing other states.
- Example: The “Heating” state contains the substates “Activating” and “Active.”
Step-by-Step Walkthrough
Let’s walk through the thermostat control system step by step:
- Initial State:
- The state machine begins at the initial state.
- The transition to the “Idle” state is triggered automatically.
- Idle State:
- The “Idle” state represents the thermostat being inactive.
- The transition to the “Cooling” state is triggered by the
tooHot(desiredTemp)event. - The transition to the “Heating” state is triggered by the
tooCold(desiredTemp)event.
- Cooling State:
- The “Cooling” state represents the thermostat actively cooling the environment.
- The transition back to the “Idle” state is triggered by the
atTempevent when the desired temperature is reached. - The transition to the final state is triggered by the
tooCold(desiredTemp)event.
- Heating State:
- The “Heating” state represents the thermostat actively heating the environment.
- The transition back to the “Idle” state is triggered by the
atTempevent when the desired temperature is reached. - The “Heating” state contains the substates “Activating” and “Active.”
- Activating State (Nested State):
- The “Activating” state represents the initial phase of the heating process.
- The transition to the “Active” state is triggered by the
readyevent, with theturnOn()action performed during the transition.
- Active State (Nested State):
- The “Active” state represents the thermostat actively heating the environment.
- The transition back to the “Idle” state is triggered by the
atTempevent when the desired temperature is reached.
Key Concepts Illustrated
- State Transitions:
- The diagram illustrates various state transitions triggered by events such as
tooHot(desiredTemp),tooCold(desiredTemp), andatTemp.
- The diagram illustrates various state transitions triggered by events such as
- Nested States:
- The “Heating” state contains the substates “Activating” and “Active,” demonstrating hierarchical states.
- Actions:
- The
turnOn()action is performed during the transition from “Activating” to “Active,” showing how actions can be associated with transitions.
- The
- Initial and Final States:
- The initial state and final states represent the start and end points of the state machine, respectively.
Why Visual Paradigm is One of the Best UML Software for Developers
Visual Paradigm is a powerful and comprehensive UML modeling tool that offers a wide range of features to support software development. Here are some reasons why Visual Paradigm stands out:
- User-Friendly Interface:
- Visual Paradigm provides an intuitive and easy-to-use interface, making it accessible for both beginners and experienced developers.
- Drag-and-drop functionality simplifies the creation and editing of UML diagrams.
- Comprehensive UML Support:
- Visual Paradigm supports all types of UML diagrams, including state diagrams, activity diagrams, sequence diagrams, and more.
- Advanced features like code generation, reverse engineering, and model-driven development enhance the software development process.
- Collaboration Tools:
- Visual Paradigm offers robust collaboration features, allowing teams to work together on UML models in real-time.
- Integration with version control systems ensures that changes are tracked and managed efficiently.
- Customization and Extensibility:
- Visual Paradigm allows for extensive customization, including custom UML profiles and stereotypes.
- The tool can be extended with plugins and integrations to fit specific project needs.
- Documentation and Reporting:
- Visual Paradigm generates detailed documentation from UML models, making it easier to communicate design decisions and requirements.
- Customizable reports and diagrams can be exported in various formats (PDF, PNG, SVG, etc.).
Conclusion
UML state diagrams are invaluable for understanding and designing the dynamic behavior of systems that undergo various states over time. By breaking down the thermostat control system example, we have seen how state diagrams can capture the different states of an object and the transitions between those states in response to events. This example demonstrates the practical application of state diagrams in real-world scenarios, making it easier to learn and apply UML in software development.
Visual Paradigm is one of the best UML software tools for developers, offering a user-friendly interface, comprehensive UML support, collaboration tools, customization options, and robust documentation features. Whether you are a beginner or an experienced developer, Visual Paradigm provides the tools and features you need to master UML modeling and enhance your software development process. So, start practicing with more examples and explore the powerful features of Visual Paradigm to become proficient in UML state diagrams and other UML diagrams.
