Creating an Interaction Overview Diagram involves understanding its purpose and methodology. Here’s a consolidated breakdown of the key components:
What
An Interaction Overview Diagram is a visual representation that allows users to engage dynamically with the content. It typically consists of:
- Key Concepts: Major components or processes within the system.
- Connections: Relationships between these components.
- Interactivity: Features that enable user engagement, such as tooltips, clickable elements, or animations.
Why
The purposes of an Interaction Overview Diagram include:
- Enhanced Understanding: Simplifies complex information, making it easier for users to grasp.
- Engagement: Encourages active exploration of content rather than passive reading.
- Clarity: Clarifies relationships and processes through a visual format.
- Accessibility: Provides a user-friendly approach that caters to different learning styles.
When
Use an Interaction Overview Diagram in scenarios such as:
- Training and Education: To teach new concepts or processes effectively.
- Project Presentations: To summarize project goals, workflows, and outcomes.
- Process Mapping: To visualize workflows, decision paths, and interactions within a system.
- User Manuals: To guide users through software features or functionalities.
How
To create an Interaction Overview Diagram, follow these steps:
- Define Objectives:
- Determine the purpose of the diagram and identify the target audience.
- Identify Key Components:
- List the main concepts or processes to be included.
- Establish Relationships:
- Define how the components connect and interact with each other.
- Choose Tools:
- Utilize software like Lucidchart, Microsoft Visio, or online platforms like Miro for diagram creation.
- Design the Diagram:
- Create a clear layout with a logical flow, using colors, shapes, and icons to differentiate components.
- Add Interactivity:
- Implement features such as tooltips, clickable links, or embedded videos to provide additional context.
- Consider using HTML/CSS/JavaScript for web-based diagrams.
- Test and Refine:
- Gather feedback to improve usability and clarity. Adjust based on user interactions to enhance the experience.
- Deploy and Share:
- Make the diagram accessible to your audience, whether on a website, in a presentation, or through an educational platform.
Example: Student Admission Process
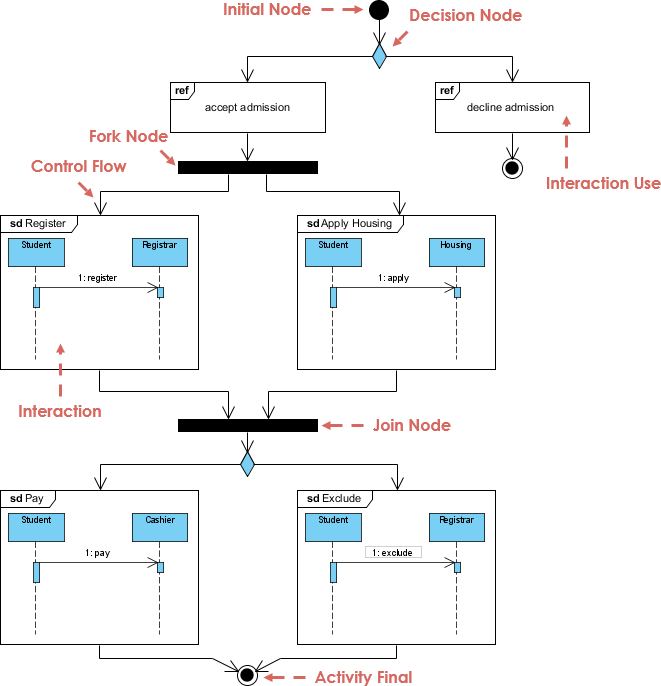
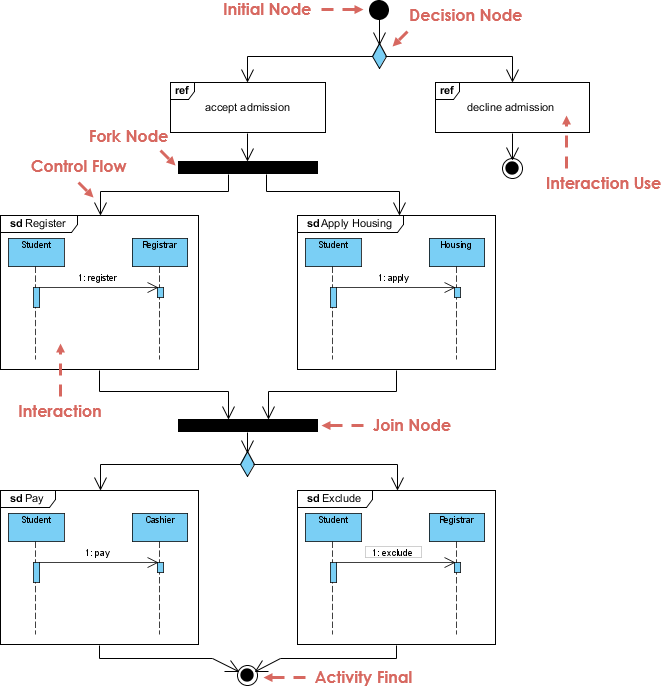
The diagram is a UML (Unified Modeling Language) activity diagram that visually represents the workflow of a student admission process. Key components include:
- Initial Node: Marks the starting point of the process.
- Decision Node: Indicates a branching point based on conditions (accepting or declining admission).
- Fork Node: Splits the flow into multiple paths for further actions.
- Activity States: Represents specific activities such as registering, applying for housing, paying fees, and excluding oneself from a process.
- Join Node: Combines multiple activity flows into a single flow.
- Activity Final Node: Signifies the conclusion of the process.
Interpretation
- Initial Node: The admission process begins here.
- Decision Node:
- Evaluates whether the student’s admission is accepted or declined.
- Acceptance leads to further activities, while decline stops the process.
- Fork Node:
- If admission is accepted, the control flow splits into several activities:
- sd Register: The student registers with the registrar.
- sd Apply: The student applies for housing after registration.
- sd Pay: The student pays fees to the cashier.
- sd Exclude: The student can opt to exclude themselves from certain processes.
- If admission is accepted, the control flow splits into several activities:
- Join Node:
- All activities converge here after completion, allowing the process to continue.
- Activity Final Node:
- Marks the end of the admission process.
Concept
The diagram illustrates the structured workflow of the student admission process, emphasizing:
- Decision-Making: Highlights the significance of decision points that affect the flow of activities.
- Interactions: Shows how various roles (students, registrar, cashier) interact during the process.
- Control Flow: Demonstrates the sequence and conditions under which activities occur, showcasing how different paths can be taken based on decisions.
- Process Completion: Provides a clear indication of process initiation and conclusion, ensuring a logical flow from start to finish.
Overall, the Interaction Overview Diagram effectively captures the complexity of the admission process, making it easier to understand the interactions and decisions involved.
Conclusion
In summary, an Interaction Overview Diagram serves as a powerful tool for visualizing complex processes, enhancing understanding, and facilitating user engagement. By clearly outlining key components, relationships, and interactive elements, these diagrams provide a structured approach to conveying information effectively.
Utilizing such diagrams in various contexts—such as training, project presentations, and process mapping—allows for improved clarity and accessibility, catering to diverse learning styles. The example of the student admission process illustrates how these diagrams can encapsulate intricate workflows, highlighting decision-making points and interactions among various roles.
Overall, Interaction Overview Diagrams not only simplify complex information but also foster a deeper understanding of processes, making them invaluable assets in both educational and professional settings. By following the outlined steps for creating these diagrams, organizations can enhance communication, streamline workflows, and ultimately drive better outcomes.
Discover Visual Paradigm, one of the leading tools for creating UML diagrams, offering both free and paid versions to suit your needs. With its user-friendly interface and powerful features, Visual Paradigm makes it easy to design professional-grade UML diagrams, whether you’re a beginner or an experienced user. Available on both desktop and cloud platforms, it provides the flexibility to work wherever you are. Whether you’re collaborating with a team or designing independently, Visual Paradigm’s extensive library of templates and intuitive tools streamline the diagramming process, ensuring you can bring your ideas to life with ease. Elevate your project management and software development efforts with Visual Paradigm today!

