Introduction
An Interaction Overview Diagram (IOD) in UML (Unified Modeling Language) provides a high-level view of the interactions within a system. It combines elements from Activity Diagrams and Sequence Diagrams to show the control flow and interactions between different parts of the system. This tutorial will guide you through creating an Interaction Overview Diagram using Visual Paradigm, which is widely regarded as one of the best UML tools for software developers.

Key Concepts
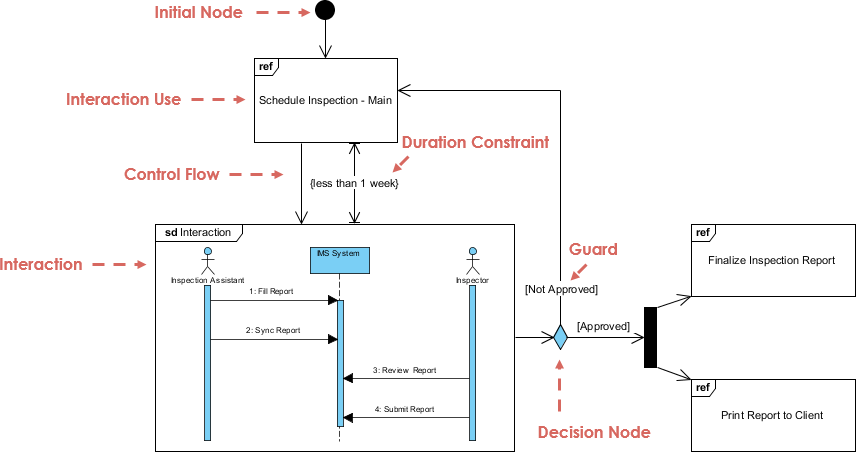
1. Initial Node
The Initial Node represents the starting point of the interaction. It is depicted as a solid black circle.
2. Interaction Use
Interaction Use represents a reference to another interaction diagram. It is depicted as a rectangle with the keyword ref.
3. Control Flow
Control Flow shows the sequence in which interactions occur. It is depicted as an arrow connecting different elements.
4. Duration Constraint
Duration Constraint specifies the time limit within which an interaction must be completed. It is depicted as a brace with the time constraint written inside.
5. Interaction
Interaction represents a sequence of messages exchanged between lifelines. It is depicted as a rectangle with the keyword sd (sequence diagram).
6. Guard
Guard represents a condition that must be true for the control flow to proceed. It is depicted as a diamond with the condition written inside.
7. Decision Node
Decision Node represents a point where the control flow can branch based on a condition. It is depicted as a diamond with multiple outgoing arrows.
Creating an Interaction Overview Diagram in Visual Paradigm
Step 1: Setting Up Visual Paradigm
- Download and Install Visual Paradigm: Visit the Visual Paradigm website and download the software. Follow the installation instructions.
- Create a New Project: Open Visual Paradigm and create a new project.
Step 2: Creating the Diagram
- Open the Diagram Tool: Go to
Diagram>New>Interaction Overview Diagram. - Add Initial Node: Drag the Initial Node from the Diagram Toolbar to the canvas.
- Add Interaction Use: Drag the Interaction Use element to the canvas and label it
Schedule Inspection - Main. - Add Control Flow: Connect the Initial Node to the Interaction Use with a Control Flow arrow.
- Add Duration Constraint: Right-click on the Control Flow arrow and select
Add Duration Constraint. Enter the constraint (e.g.,{less than 1 week}). - Add Interaction: Drag the Interaction element to the canvas and label it
sd Interaction. - Add Lifelines and Messages: Inside the Interaction element, add lifelines for
Inspector/AssistantandManager. Add messages between them (e.g.,Fill Report,Sync Report,Review Report,Submit Report). - Add Guard: Drag the Guard element to the canvas and label it
[Not Approved]and[Approved]. - Add Decision Node: Drag the Decision Node to the canvas and connect it to the Guard elements.
- Add Final Interactions: Add the final Interaction Use elements for
Finalize Inspection ReportandPrint Report to Client.
Step 3: Refining the Diagram
- Adjust Layout: Arrange the elements to ensure the diagram is clear and easy to read.
- Add Annotations: Use notes to add any additional information or constraints.
- Validate the Diagram: Use Visual Paradigm’s validation tools to ensure the diagram is correct.
Example Diagram Explanation
The provided example diagram illustrates the process of scheduling and finalizing an inspection report. Here’s a breakdown:
- Initial Node: The process starts here.
- Schedule Inspection – Main: This is the main interaction that must be completed within a week.
- Control Flow: The process flows from scheduling the inspection to the detailed interaction.
- Duration Constraint: The scheduling must be completed in less than a week.
- Interaction (sd Interaction): This sequence diagram shows the detailed steps:
Inspector/Assistantfills the report.- The report is synced with the
IMS System. Managerreviews the report.- The report is submitted.
- Guard: The process branches based on whether the report is approved or not.
- Decision Node: The control flow branches to either finalize the report or print it to the client.
Conclusion
Visual Paradigm is an excellent tool for creating UML diagrams, including Interaction Overview Diagrams. Its intuitive interface and powerful features make it the best choice for software developers. By following this tutorial, you can create comprehensive and accurate Interaction Overview Diagrams to model the interactions within your system effectively.
For more information and advanced features, visit the Visual Paradigm website.
