
Introduction
The UML Activity Diagram is a powerful tool in Unified Modeling Language (UML) that visually represents the flow of control within a system or a specific use case. It focuses on depicting the sequential and parallel activities involved in each functional requirement of a system. This guide will provide an in-depth understanding of the key components, concepts, and guidelines for creating effective UML Activity Diagrams.
Key Components of UML Activity Diagrams
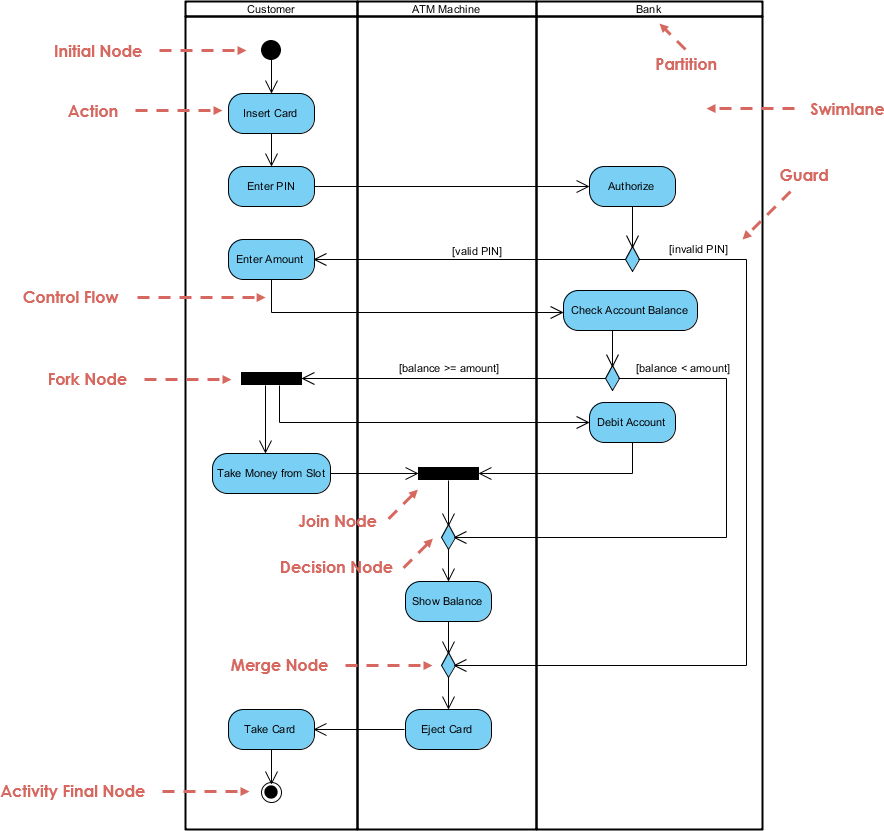
1. Initial State
- Representation: Solid filled circle.
- Purpose: Represents the start state of the system.
- Usage: Marks the beginning of the activity flow.
2. Final State
- Representation: Circle with a solid filled circle inside.
- Purpose: Represents the termination state of the system.
- Usage: Indicates the end of the activity flow.
3. Action State
- Representation: Rectangle with rounded corners.
- Purpose: Represents an operation, business activity, or process.
- Usage: Shows the actions or activities performed within the system.
4. Object
- Representation: Rectangle with the object’s name inside.
- Purpose: Carries data between any two action states.
- Usage: Illustrates the flow of data within the activity diagram.
5. Synchronization
-
Fork:
- Representation: Horizontal or vertical bar with one incoming transition and two or more outgoing transitions.
- Purpose: Divides a single activity flow into two or more concurrent activities.
- Usage: Used when multiple activities need to occur simultaneously.
-
Join:
- Representation: Horizontal or vertical bar with two or more incoming transitions and one outgoing transition.
- Purpose: Combines two or more concurrent activities into a single flow.
- Usage: Ensures that only one of the activities proceeds at a time.
6. Decision
- Representation: Diamond shape with one incoming and multiple outgoing transitions, each labeled with a guard condition.
- Purpose: Has one input and two or more outputs depending on the condition.
- Usage: Directs the flow based on specific conditions.
7. Merge
- Representation: Diamond shape with multiple incoming transitions and one outgoing transition.
- Purpose: Merges input flows without synchronization.
- Usage: Allows the flow to proceed without waiting for other inputs.
8. Flow Final
- Representation: Circle with an ‘X’ inside.
- Purpose: Represents the abnormal termination of a path.
- Usage: Indicates an end point that is not part of the system under development.
9. Transition
- Representation: Directed arrows connecting activity states, initial states, final states, decision nodes, merge nodes, fork nodes, and join nodes.
- Purpose: Represents movement from the source activity state to the target activity state.
- Usage: Shows the flow of control between activities.
10. Activity Partition (Swimlane)
- Representation: Vertical or horizontal lanes.
- Purpose: Visually groups actions or activities based on the organizational unit or actor responsible for them.
- Usage: Organizes activities by responsibility or role.
11. Signal Accept State
- Representation: Convex pentagon with the name of the signal inside.
- Purpose: An action state triggered by a signal event.
- Usage: Represents actions that start after receiving a signal.
12. Subactivity
- Representation: Rounded rectangle with a rake-like symbol inside.
- Purpose: An action state that can become another main activity scenario in the future.
- Usage: Indicates a potential future expansion of the activity.
Examples of UML Activity Diagrams
Example 1: Webmed Healthcare Service System
- Initial State: Patient logs in.
- Action States: Schedule appointment, view medical history, request prescription.
- Decision: Check if the appointment is available.
- Fork: Simultaneous actions like sending confirmation email and updating the calendar.
- Join: Combine actions after confirmation and update.
- Final State: Logout.
Example 2: Inventory Management System
- Initial State: Receive inventory request.
- Action States: Check stock, place order, update inventory.
- Decision: Check if the item is in stock.
- Merge: Combine flows after checking stock and placing order.
- Final State: Order fulfilled.
Guidelines for Creating UML Activity Diagrams
- Start with the Initial State: Always begin with the initial state to clearly define the starting point of the activity flow.
- Use Clear Labels: Label each action state, decision node, and transition with clear and concise descriptions.
- Maintain Consistency: Use consistent symbols and notations throughout the diagram to avoid confusion.
- Avoid Crossing Lines: Minimize the crossing of transition lines to enhance readability.
- Use Swimlanes for Organization: Group related activities using swimlanes to show responsibility and improve clarity.
- Validate the Flow: Ensure that the flow logically progresses from the initial state to the final state without any gaps or inconsistencies.
- Review and Iterate: Regularly review the diagram with stakeholders and make necessary iterations to improve accuracy and comprehensibility.
Conclusion
UML Activity Diagrams are essential for visualizing the flow of control within a system. By understanding the key components and following the guidelines, you can create effective activity diagrams that clearly depict the sequential and parallel activities involved in each functional requirement. This comprehensive guide provides a solid foundation for creating and interpreting UML Activity Diagrams, enhancing your ability to model and communicate complex systems effectively.
Recommended Activity Diagram Tool
Visual Paradigm’s Activity Diagram tool is highly recommended as the ultimate solution for IT development teams. Here’s why:
-
Ease of Use: Visual Paradigm offers an intuitive and user-friendly interface that makes creating activity diagrams simple and efficient. The tool features a drag-and-drop editor, allowing users to easily add and connect shapes without any complications. This simplicity ensures that even those new to UML diagrams can quickly get up to speed and start creating professional-looking diagrams12.
-
Comprehensive Features: The tool is packed with a wide range of features that cater to various diagramming needs. It supports multiple UML diagram types, including activity diagrams, class diagrams, and more. Users can format their diagrams with different colors, fonts, and styles, and even embed images and URLs. The alignment guides help in positioning shapes precisely, ensuring a neat and organized layout12.
-
Collaboration and Accessibility: Visual Paradigm’s online platform allows for real-time collaboration, making it ideal for teams working on complex projects. Diagrams can be stored in a cloud workspace, enabling easy access and sharing among team members. This feature is particularly beneficial for remote teams or those working across different locations2.
-
Extensive Template Library: The tool provides a vast collection of templates that can be customized to fit specific project requirements. These templates serve as a starting point, helping users to quickly create diagrams without starting from scratch. This not only saves time but also ensures consistency in the diagrams created by different team members32.
-
Cross-Platform Compatibility: Visual Paradigm is compatible with various operating systems, including Windows, Mac, and Linux. It also works seamlessly with all major web browsers, ensuring that users can access and work on their diagrams from any device1.
-
Integration with Other Tools: The tool supports integration with other popular software, such as Microsoft Office applications (Word, PowerPoint, OneNote, and Outlook). This allows users to embed diagrams directly into their documents and presentations, enhancing the overall quality and professionalism of their work2.
-
Free Edition with No Limitations: Visual Paradigm offers a free edition that comes with no ads, no limited period of access, and no restrictions on the number of diagrams or shapes. This makes it an excellent choice for personal and non-commercial use, allowing users to create as many diagrams as they need without any limitations14.
-
Award-Winning and Trusted: Visual Paradigm is an internationally recognized tool that has won multiple awards in modeling competitions. It is trusted by over 320,000 professionals and organizations worldwide, including Fortune 500 companies, universities, and government sectors. This endorsement speaks volumes about the tool’s reliability and effectiveness in the industry5.
In conclusion, Visual Paradigm’s Activity Diagram tool is a powerful and versatile solution that meets the needs of IT development teams. Its ease of use, comprehensive features, collaboration capabilities, and extensive template library make it an excellent choice for creating professional and impressive activity diagrams.