Business Process Modeling (BPM) is an essential practice for organizations seeking to improve efficiency, streamline operations, and enhance communication among stakeholders. One powerful tool within BPM is the UML (Unified Modeling Language) Activity Diagram. This article explores the UML Activity Diagram approach, offering guidelines, examples, and practical tips for effective business process modeling.
What is an Activity Diagram?
An Activity Diagram is a type of UML (Unified Modeling Language) diagram that visually represents the flow of activities in a process. It is used to model the dynamic aspects of a system, illustrating how different tasks are performed, the sequence of actions, and the flow of control between various elements.
Key Components of Activity Diagrams
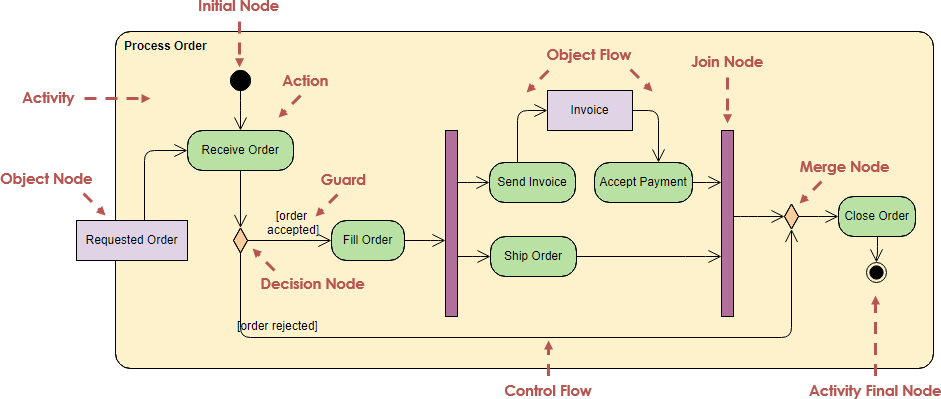
- Initial Node: The starting point of the diagram.
- Activity Nodes: Represent tasks or activities in the process.
- Action Nodes: Specific actions that occur within an activity.
- Decision Nodes: Points where the flow can branch based on conditions.
- Control Flows: Arrows that indicate the direction of the flow between nodes.
- Merge Nodes: Combine multiple flow paths into one.
- Join Nodes: Synchronize multiple flows into a single flow.
- Final Node: Indicates the end of the process.
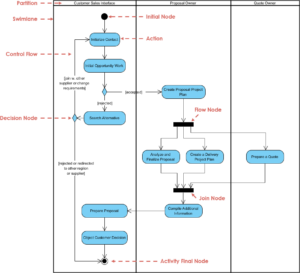
- Swimlanes: Separate different actors or roles involved in the process.
Why Use Activity Diagrams?
Activity Diagrams serve several important purposes in both business and software development contexts:
- Visual Representation: They provide a clear visual representation of processes, making it easier to understand complex workflows.
- Clarify Roles and Responsibilities: By using swimlanes, Activity Diagrams can delineate responsibilities among different actors, helping to clarify who does what in a process.
- Identify Bottlenecks: By mapping out the flow of activities, organizations can identify potential bottlenecks or inefficiencies in their processes.
- Facilitate Communication: These diagrams serve as effective communication tools among stakeholders, ensuring everyone has a shared understanding of the process.
- Support Documentation: They can be included in project documentation to provide a visual overview of processes, making it easier for new team members to understand workflows.
- Enhance Process Improvement: By analyzing Activity Diagrams, teams can pinpoint areas for improvement, leading to more efficient practices.
How to Create an Activity Diagram
Creating an Activity Diagram involves several steps:
Step 1: Define the Scope
Identify the process you want to model. Clearly outline the start and end points.
Step 2: Gather Requirements
Collaborate with stakeholders to gather requirements and understand the activities involved in the process.
Step 3: Identify Activities and Decisions
List all the activities in the process and determine where decisions are made. This will help in mapping out the flow.
Step 4: Select a Diagramming Tool
Choose a UML diagramming tool, such as Visual Paradigm, or draw.io, to create your diagram.
Step 5: Create the Diagram
- Start with the Initial Node: Mark the beginning of the process.
- Add Activity Nodes: Include all activities in the order they occur.
- Incorporate Decision Nodes: Identify points where decisions affect the flow.
- Use Control Flows: Draw arrows to show the direction of the flow.
- Add Swimlanes: If applicable, separate activities by role using swimlanes.
Understanding UML Activity Diagrams
UML Activity Diagrams are graphical representations that depict the flow of activities in a process. They illustrate how different tasks are interconnected, highlighting the roles of various participants and the flow of information between them.
Key Components of UML Activity Diagrams
- Initial Node: Marks the starting point of the process.
- Activity/Action Nodes: Represent specific tasks or actions performed in the workflow.
- Object Nodes: Indicate the data or objects involved in the process.
- Decision Nodes: Points where a choice must be made, affecting the flow of control.
- Guard Conditions: Specify conditions under which certain actions are taken.
- Control Flows: Arrows indicating the direction of the process flow.
- Join Nodes: Combine multiple flows into a single flow.
- Merge Nodes: Combine multiple decision paths into one.
- Final Node: Indicates the end of the process.
Case Study – QuickShop

Scenario Description
- Initial Order Reception:
- Customers place orders on the QuickShop website, and these orders are received by the system.
- The first step in the process is to Receive Order. However, there have been instances where orders are not correctly logged due to technical glitches, leading to missed orders.
- Invoice Generation:
- Once an order is received, an Invoice is generated and sent to the customer.
- The system sometimes fails to send invoices due to connectivity issues, causing confusion for customers who expect immediate confirmation.
- Payment Processing:
- The next step is to Send Invoice to the customer and wait for payment.
- Customers may choose to pay via different methods (credit card, PayPal, etc.), but the system does not always handle failed transactions gracefully. When payments are declined, customers receive vague error messages, leading to frustration.
- Decision Point:
- After sending the invoice, the system checks if the Invoice has been accepted (payment received).
- If the payment is accepted, the system proceeds to the Fill Order step. However, if the payment is rejected, the system should ideally initiate a follow-up process to address payment issues, but this step is often skipped.
- Order Fulfillment:
- Assuming the payment is accepted, the order is then Filled and prepared for shipping.
- However, due to inventory management issues, there have been incidents where items are out of stock, leading to delays in shipping. Customers are often unaware of these delays until they reach out for updates.
- Shipping:
- Once the order is filled, it moves to the Ship Order stage.
- Customers are not always notified when their orders are shipped, leading to uncertainty about delivery timelines.
- Closing the Order:
- Finally, the process culminates in the Close Order step.
- The closure of orders is sometimes not reflected in the system, resulting in discrepancies in inventory and financial reporting.
Guidelines for Creating UML Activity Diagrams
- Define the Scope: Clearly outline the boundaries of the process you wish to model. Identify the start and end points.
- Identify Actors: Determine the roles involved in the process and what actions each will perform.
- Break Down Activities: List all activities in the order they occur, including decisions and conditions.
- Use Swimlanes: Organize activities by role using swimlanes to clarify responsibilities.
- Employ Decision Nodes: Clearly represent decision points to show how the flow can change based on conditions.
- Label Clearly: Use descriptive labels for nodes and actions to enhance understanding.
- Keep It Simple: Avoid clutter. Focus on key activities to maintain clarity.
Tips and Tricks
- Iterate and Refine: Don’t hesitate to revise your diagram as you gather feedback. Iteration is key to refining your process model.
- Collaborate: Involve stakeholders in the modeling process to ensure accuracy and gather diverse perspectives.
- Use Software Tools: Leverage UML diagramming tools like Visual Paradigm, Lucidchart, or draw.io for creating professional diagrams.
- Focus on Flow: Ensure that the flow of control is logical and easy to follow. Use directional arrows to guide readers.
- Document Assumptions: Note any assumptions or conditions that affect the process to provide context.
-
Step 6: Review and Revise
Share the diagram with stakeholders for feedback. Make necessary revisions based on their input.
Step 7: Finalize and Document
Once finalized, document the diagram as part of your project materials, ensuring it is accessible for future reference.
Conclusion
UML Activity Diagrams are a versatile and powerful method for business process modeling. By visually representing actions, decisions, and interactions among roles, these diagrams facilitate understanding and communication within organizations. Following the guidelines and tips provided in this article will help you create effective and informative Activity Diagrams that enhance your BPM efforts, ultimately leading to improved efficiency and productivity.
