What is an Activity Diagram?
An Activity Diagram is a type of diagram used in the Unified Modeling Language (UML) to represent the dynamic aspects of a system. It models the flow of control or data from one activity to another within a system, making it particularly useful for visualizing complex processes.
Who Uses Activity Diagrams?
Activity diagrams are utilized by a variety of professionals in different fields. Here’s a breakdown of who commonly uses them:
- Business Analysts:
- To model business processes and workflows, helping to identify inefficiencies and areas for improvement.
- System Analysts:
- To analyze and design systems, ensuring all required activities are captured and understood in the development process.
- Software Developers:
- To understand the flow of control within applications, aiding in the implementation of complex functionalities.
- Project Managers:
- To visualize project workflows and timelines, helping in planning and resource allocation.
- Quality Assurance (QA) Engineers:
- To develop test cases based on the defined workflows, ensuring that all scenarios are covered during testing.
- UX/UI Designers:
- To understand user interactions within a system, helping to create user-friendly interfaces based on the flow of activities.
- Stakeholders/Clients:
- To gain insights into how a system or process works, ensuring that their requirements are being met.
- Educators and Students:
- To teach and understand modeling concepts in software engineering and system design courses.
Applications of Activity Diagrams
- Software Development: To model workflows within applications, such as user authentication or order processing.
- Business Process Management: To document and analyze business processes, facilitating process reengineering.
- System Design: To illustrate interactions within systems, helping in both high-level design and detailed implementation.
- Agile Methodologies: To visualize user stories and tasks within sprints, enhancing team collaboration.
Key Components
- Initial Node: Indicates the starting point of the activity.
- Action Node: Represents a specific action or task.
- Decision Node: A point where a decision needs to be made, leading to different flows.
- Fork Node: Splits a flow into multiple concurrent flows.
- Join Node: Merges multiple flows back into one.
- Merge Node: Combines different flows into one, often following a decision.
- Final Node: Indicates the end of the activity.
- Control Flow: Arrows showing the direction of the activity flow.
- Guard Conditions: Conditions that must be met for a particular flow to be taken.
Why Develop an Activity Diagram?
- Visual Representation: Activity diagrams provide a clear visual representation of workflows, making it easier to understand complex processes.
- Identify Flows: They help identify the flow of activities, decisions, and parallel processes within a system, promoting better analysis of the workflow.
- Communication Tool: These diagrams serve as a communication tool among stakeholders, including developers, analysts, and business users.
- Process Improvement: By mapping out current workflows, organizations can identify bottlenecks or inefficiencies and make informed decisions for process improvement.
- Documentation: Activity diagrams serve as essential documentation for systems and processes, aiding in onboarding new team members and maintaining project knowledge.
How to Develop an Activity Diagram
Step 1: Define the Purpose
- Identify the process you want to model. Clearly define the scope and objectives of the activity diagram.
Step 2: Gather Requirements
- Collect information about the process, including inputs, outputs, tasks, decisions, and roles involved. Engage stakeholders to ensure all aspects are covered.
Step 3: Identify Key Components
- Initial Node: Start point of the process.
- Action Nodes: Tasks or activities performed.
- Decision Nodes: Points where decisions are made, leading to different flows.
- Fork/Join Nodes: Points where processes split or converge.
- Final Node: End point of the process.
- Control Flows: Arrows indicating the sequence of activities.
Step 4: Map the Activities
- Start with the Initial Node: Begin your diagram by placing the initial node.
- Add Action Nodes: Sequentially add action nodes to represent each activity in the process.
- Incorporate Decision Nodes: For each decision point, use a decision node to show branching paths based on conditions.
- Use Fork and Join Nodes: If activities can occur simultaneously, use fork nodes to split the flow and join nodes to bring it back together.
- Connect with Control Flows: Use arrows to indicate the flow of control from one activity to the next.
- End with the Final Node: Conclude the diagram with a final node indicating the completion of the process.
Step 5: Review and Refine
- Share the draft diagram with stakeholders for feedback. Make adjustments based on their input to ensure accuracy and clarity.
Step 6: Document Assumptions and Conditions
- Clearly document any assumptions and guard conditions associated with decision nodes, as this adds context to the diagram.
Step 7: Finalize and Share
- Once finalized, share the activity diagram with the relevant stakeholders and use it as part of your project documentation.
Example Library Book Borrowing Process
Here’s a simple example of developing an activity diagram for a Library Book Borrowing Process:
- Initial Node: Start the borrowing process.
- Action Node: Search for the book.
- Decision Node: Is the book available?
- Yes: Proceed to borrow the book.
- No: Notify the user that the book is not available.
- Action Node: Complete borrowing process (fill out form, etc.).
- Final Node: End the borrowing process.
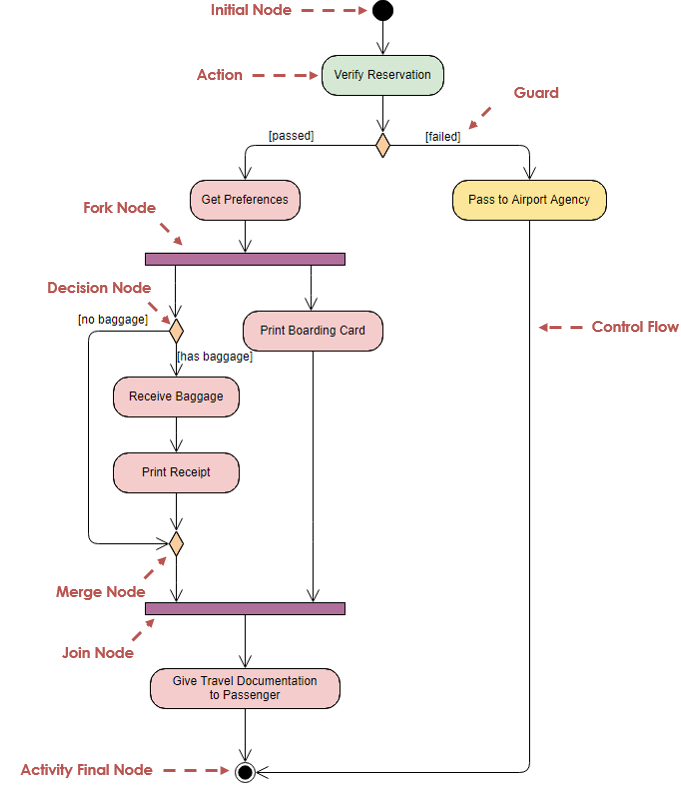
Case Study: Airport Reservation System
Scenario
Imagine an airport reservation system where a passenger wants to verify their flight reservation and receive necessary travel documentation.
Activity Diagram Steps
- Initial Node: Start the reservation verification process.
- Action Node: Verify reservation details.
- Decision Node: Is the reservation valid?
- Guard (Passed): If valid, proceed to get preferences.
- Guard (Failed): If invalid, pass to the airport agency for assistance.
- Action Node: Get preferences (e.g., meal choice).
- Fork Node: Split into:
- Print boarding card
- Receive baggage details
- Join Node: Wait for both actions to complete.
- Action Node: Give travel documentation to the passenger.
- Final Node: End of the process.
Visual Representation
Here’s the activity diagram based on the case study:

Conclusion
Activity diagrams are powerful tools for visualizing processes and understanding system workflows. By breaking down actions, decisions, and flow control, they provide clarity and facilitate better communication among stakeholders. Use the examples and case study provided to create your own diagrams for various processes!
Activity diagrams are versatile tools used by various professionals across different domains. They play a crucial role in understanding, analyzing, and documenting workflows, making them invaluable in both technical and business contexts.
