UML Timing Diagrams are a type of interaction diagram that focuses on the time constraints of various events within a system. They are useful for modeling the behavior of objects over time, particularly in systems where timing is crucial, such as network protocols, control systems, and real-time applications.
Key Points
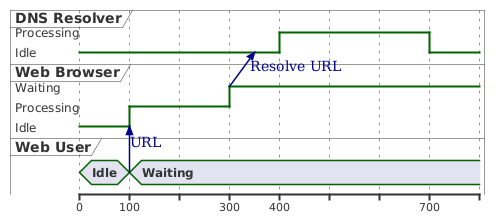
- The entire interaction highlights the asynchronous nature of web requests and the importance of timely responses from the DNS resolver to enhance user experience.
- The timing diagram visually represents the states and transitions of each component, showing how the user’s experience is influenced by the processing times of the web browser and the DNS resolver.
- Understanding this scenario helps in optimizing the resolution process, ensuring quicker and more efficient web browsing experiences for users.
Concepts of UML Timing Diagrams

The timing diagram provides a visual representation of the interactions and states of a system involving a user, specifically in the context of a user account management system. Here’s a detailed breakdown of its key components:
Key Components
- Lifeline:
- The diagram features a lifeline labeled UserAcc_User, which represents the user interacting with the account management system. It serves as the central focus of the timing diagram.
- State:
- The vertical segments of the lifeline indicate different states that the user can be in throughout the interaction:
- Idle: The initial state where the user is not performing any action.
- WaitAccess: The user is waiting to gain access to the system.
- WaitCard: The user is waiting for a card-related action or event.
- Code: The user is actively engaged in entering or processing a code.
- The vertical segments of the lifeline indicate different states that the user can be in throughout the interaction:
- Duration Constraint:
- The notation
{d:3*d}indicates a duration constraint, specifying that the user will remain in a particular state for a duration defined by the variabled. This notation helps in understanding how long the user is expected to stay in that state.
- The notation
- Time Unit:
- The horizontal axis represents Time Units, which are used to measure the duration of each state. The time increments are labeled, helping to visualize the progression of time in the interaction.
- Stimuli:
- The arrows labeled Stimuli indicate events or actions that trigger transitions between states. For example, a stimulus might represent the user initiating a request to access their account.
- Time Constraint:
- The notation
{t:1+3}shows a time constraint indicating the specific timing requirements for transitioning from one state to another. This helps in managing the timing aspects of processes within the system.
- The notation
Web Timing Diagram Example
In a web application environment, a user initiates a request to access a specific webpage by entering a URL in their web browser. This interaction involves multiple components, including the web browser, the DNS resolver, and the web user. The timing diagram illustrates how these components interact over time during the URL resolution process.
Scenario Description
- User Action:
- A web user begins in the Idle state, indicating they are not actively engaging with the browser.
- The user enters a URL into the web browser, transitioning the user to the Waiting state as they await a response.
- Web Browser Behavior:
- Upon receiving the URL, the web browser transitions from Waiting to Processing. It begins the process of resolving the entered URL.
- The web browser sends a request to the DNS Resolver to resolve the URL, indicating this action with a message labeled “Resolve URL”.
- DNS Resolver Processing:
- The DNS Resolver starts in the Idle state. Once it receives the URL resolution request from the web browser, it transitions to the Processing state.
- The DNS Resolver works to resolve the URL, which takes some time.
- Resolution Completion:
- After the DNS Resolver completes its processing, it sends back the resolved IP address to the web browser.
- The web browser, having received the response, transitions back to the Idle state after completing the processing of the resolved URL.
- User Experience:
- Throughout this process, the user remains in the Waiting state until the browser completes the URL resolution. Once the resolution is done and the webpage is loaded, the user may return to Idle.

Key Components
- Lifelines:
- Represent individual participants or objects in the interaction (e.g., DNS Resolver, Web Browser, Web User).
- Positioned horizontally across the diagram.
- State Timeline:
- Shows the various states of each lifeline over time.
- States are typically labeled and displayed in a stacked format.
- Messages:
- Indicate events that trigger state changes.
- Represented by arrows connecting lifelines.
- Time Axis:
- The horizontal axis represents time, usually measured in specific units (milliseconds, seconds, etc.).
- Vertical ticks can indicate specific time intervals.
- Duration Constraints:
- Indicate how long an object remains in a particular state.
- Shown as horizontal lines corresponding to the state duration.
Interpretation of the Example Diagram
Let’s analyze the provided UML timing diagram:
Diagram Overview
- Lifelines:
- DNS Resolver: Processes the URL resolution.
- Web Browser: Interacts with the user and the DNS resolver.
- Web User: The end user initiating the request.
State Changes
- DNS Resolver:
- Idle: The initial state, waiting for a URL to resolve.
- Processing: Activated when a URL resolution request is received.
- Web Browser:
- Waiting: The browser is waiting for the DNS resolution to complete.
- Processing: The browser processes the result of the DNS resolution.
- Idle: The browser returns to idle after processing.
- Web User:
- Idle: The user is not actively engaged.
- Waiting: The user is waiting for the browser to complete the request.
Messages
- Resolve URL: Indicates the action taken by the web browser to request URL resolution from the DNS resolver.
Guidelines for Creating UML Timing Diagrams
- Identify Participants: Determine the key objects or participants in the interaction.
- Define States: List all the states for each participant that will be relevant to the interaction.
- Establish Time Axis: Set a time scale that will effectively represent the events and states.
- Map State Changes: Create horizontal lines for each participant that reflect their state over time.
- Indicate Messages: Use arrows to show messages between participants that trigger state changes.
- Add Duration Constraints: Clearly show how long each participant stays in a particular state.
- Review for Clarity: Ensure the diagram is readable and accurately reflects the intended interactions and timings.
Step-by-Step Guide to Creating a UML Timing Diagram
Step 1: Identify Participants
- Determine the key entities involved in the process (e.g., DNS Resolver, Web Browser, Web User).
Step 2: Define States
- For each participant, list the relevant states they can be in during the interaction.
Step 3: Set Up the Time Axis
- Draw a horizontal line at the top of the diagram to represent time.
- Mark intervals for clarity.
Step 4: Draw Lifelines
- Create horizontal lines for each participant below the time axis.
Step 5: Plot State Changes
- For each lifeline, mark the states according to how they change over time.
- Use horizontal segments to indicate periods in each state.
Step 6: Indicate Messages
- Draw arrows to represent messages exchanged between participants, labeling them appropriately.
Step 7: Add Duration Constraints
- Clearly show how long each participant remains in a particular state using horizontal segments.
Step 8: Review and Adjust
- Ensure that the diagram accurately reflects the timing and interactions.
- Make adjustments for clarity and readability.
Conclusion
UML Timing Diagrams are a powerful tool for visualizing the timing and interactions between different components in a system. By following the outlined concepts, interpretation guidelines, and step-by-step creation process, you can effectively communicate the timing behavior in your system, making it easier for stakeholders to understand complex interactions.
The timing diagram effectively illustrates the interaction between the web user, web browser, and DNS resolver during the URL resolution process. By mapping out the states and transitions of each component, we gain valuable insights into how asynchronous communication impacts user experience.
This scenario emphasizes the critical role of the DNS resolver in ensuring timely responses, as delays in this process can lead to user frustration. Understanding these dynamics enables developers and system architects to identify potential bottlenecks and optimize the resolution process, ultimately enhancing the overall performance of web applications.
In summary, timing diagrams serve as a powerful tool for visualizing and analyzing the timing and interactions within complex systems, helping stakeholders make informed decisions to improve efficiency and user satisfaction.
