What is a UML State Machine Diagram?
A UML State Machine Diagram is a visual representation of the various states that an object can be in throughout its lifecycle, along with the transitions between these states. It is part of the Unified Modeling Language (UML) and serves to depict the dynamic behavior of a system or an object.
Key Components:
- States: Represent different conditions or situations during an object’s life.
- Transitions: Arrows that indicate the movement from one state to another, triggered by events.
- Initial State: The state where the object starts its lifecycle, depicted by a filled circle.
- Final State: The state indicating the completion of the object’s lifecycle, depicted by a circle surrounding a smaller filled circle.
- Events: Conditions or occurrences that trigger transitions between states.
- Actions: Activities that occur as a result of transitions or when entering/exiting states.
Why Use a UML State Machine Diagram?
Benefits:
- Clarifies Object Behavior: Helps stakeholders understand how an object behaves in response to various events.
- Improves Communication: Provides a clear and standardized way to express dynamic behavior, making it easier for teams to discuss and analyze object interactions.
- Facilitates Design: Assists in identifying states, transitions, and actions, which can guide the development of the system.
- Supports Complex Systems: Ideal for modeling systems with complex state-dependent behavior, such as control systems, user interfaces, and workflows.
When to Use a UML State Machine Diagram?
Use Cases:
- Modeling Object Lifecycles: When you need to represent the various states an object can be in during its lifecycle.
- Behavioral Analysis: When analyzing how an object responds to events and how it changes state.
- Complex Systems: When designing systems where objects have intricate state behaviors, such as game development or embedded systems.
- Protocol Specification: In scenarios where specific protocols dictate the states and transitions of an object.
How to Create a UML State Machine Diagram
Step-by-Step Guide:
- Identify the Object:
- Determine the object or system whose states you want to model.
- Define States:
- List all possible states the object can be in. For example, in a thermostat, states might include “Idle,” “Cooling,” and “Heating.”
- Determine Events:
- Identify events that trigger transitions between states. For instance, a temperature change might trigger a transition from “Idle” to “Cooling.”
- Establish Transitions:
- Draw arrows to represent how an object moves from one state to another in response to events. Label the arrows with event names.
- Specify Initial and Final States:
- Indicate the starting state with a filled circle and the final state with a circle surrounding a smaller filled circle.
- Define Actions:
- Add actions that occur during transitions or when entering/exiting states. For example, during the transition to “Cooling,” the action might be “turn on the air conditioner.”
- Utilize Nested States (if necessary):
- For complex behaviors, you can use nested states to represent states that have their own sub-states. For example, within the “Heating” state, you might have “Activating” and “Active.”
- Review and Refine:
- Ensure the diagram accurately represents the object’s behavior and make adjustments as necessary.
Case Study: State Machine Diagram for Temperature Control System
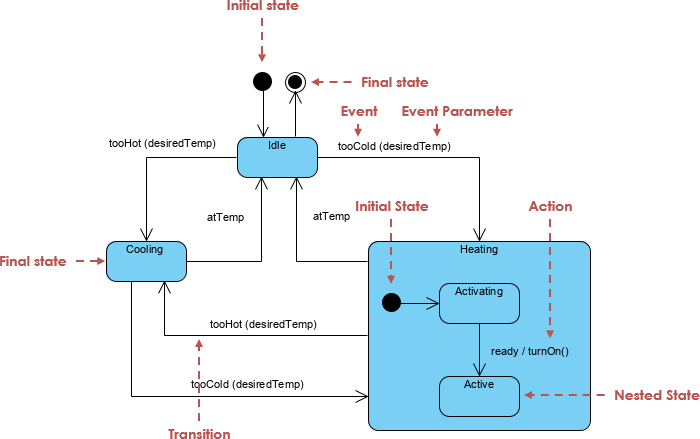
This case study explores the use of a UML State Machine Diagram to model the behavior of a Temperature Control System. The system is designed to manage the heating and cooling of a space based on temperature readings. The diagram visualizes the various states of the system, the events that trigger transitions between these states, and the actions taken during these transitions.

System Overview
The Temperature Control System operates in three primary states:
- Idle: The system is inactive, waiting for temperature conditions to change.
- Cooling: The system actively cools the environment when it detects that the temperature is too high.
- Heating: The system actively heats the environment when the temperature is too low.
States and Transitions
Initial State
- Idle: The system begins in the Idle state, where it monitors the temperature continuously.
Events and Transitions
- Event Parameter: The system evaluates temperature readings against desired parameters (e.g.,
tooHotandtooCold). - Transitions:
- From Idle to Cooling: This transition occurs when the temperature exceeds the desired maximum (
tooHot). The system activates cooling to bring the temperature down. - From Idle to Heating: This transition occurs when the temperature falls below the desired minimum (
tooCold). The system activates heating to raise the temperature. - From Cooling back to Idle: This transition occurs when the temperature returns to the desired range (
atTemp). - From Heating back to Idle: This transition occurs when the temperature returns to the desired range (
atTemp).
- From Idle to Cooling: This transition occurs when the temperature exceeds the desired maximum (
Nested State: Heating
Within the Heating state, there are further sub-states:
- Activating: The system prepares to heat the environment.
- Active: The system is actively heating the environment.
Final State
- The diagram concludes with a final state, indicating the system’s inactivity once the desired temperature range is achieved.
Actions
- Activation of Cooling/Heating: When transitioning from Idle to Cooling or Heating, the system triggers the action of initiating the respective processes (e.g., turning on air conditioning or heating units).
- Monitoring: The system continuously monitors temperature changes and adjusts its state accordingly.
Conclusion
UML State Machine Diagrams are powerful tools for modeling and understanding the dynamic behavior of objects within a system. By clearly defining states, transitions, events, and actions, these diagrams provide a comprehensive view of how an object behaves over its lifecycle. Whether you’re designing software systems, analyzing behaviors, or specifying protocols, state machine diagrams can help streamline communication and improve design clarity.
The UML State Machine Diagram effectively captures the dynamic behavior of the Temperature Control System. It allows stakeholders to visualize the states, transitions, and actions involved in maintaining the desired temperature range. This case study illustrates how such diagrams can enhance understanding, facilitate communication among team members, and serve as a valuable tool for system design and analysis.
- What is State Machine Diagram? – Visual Paradigm
- All You Need to Know about State Diagrams – Visual Paradigm
- State Machine Diagram Tutorial – Visual Paradigm
- Introduction to State Diagrams: A Comprehensive Guide for Software Engineering
- Applying State Diagrams: A Comprehensive Guide – Visual Paradigm Guides
- Mastering State Diagrams in UML: A Comprehensive Guide
- State machine diagram – Visual Paradigm
- Beginner’s Guide to State Machine Diagrams – Visual Paradigm Blog
- How to draw a state machine diagram – Visual Paradigm
- Online State Machine Diagram Tool – Visual Paradigm
