What is a Swimlane Activity Diagram?
A swimlane activity diagram is a type of flowchart that organizes activities into “swimlanes,” which are horizontal or vertical sections that represent different participants, departments, or systems involved in a process. Each swimlane contains the specific tasks or actions performed by that participant, helping to clarify responsibilities and interactions.
Why Use a Swimlane Activity Diagram?
- Clarity of Roles: It visually separates responsibilities, making it clear who is responsible for each task in a process.
- Process Visualization: It provides a comprehensive overview of the workflow, showing how different roles interact throughout the process.
- Identifying Bottlenecks: By mapping out the entire process, inefficiencies or bottlenecks can be easily identified.
- Enhanced Communication: It serves as an effective communication tool among team members, stakeholders, and decision-makers.
- Training and Documentation: Useful for training new employees and documenting processes for future reference.
How to Create a Swimlane Activity Diagram
- Define the Process:
- Identify the process you want to map out.
- Identify Participants:
- Determine the roles, departments, or systems involved in the process.
- Draw Swimlanes:
- Create horizontal or vertical lanes for each participant. Label each lane clearly.
- List Activities:
- Break down the process into individual tasks or activities. Place each activity in the appropriate swimlane.
- Determine Flow:
- Use arrows to indicate the flow of the process from one activity to the next. Include decision points where applicable.
- Review and Refine:
- Review the diagram for accuracy and clarity. Make adjustments as necessary to improve understanding.
- Finalize and Share:
- Once satisfied, finalize the diagram and share it with relevant stakeholders for feedback or implementation.
Example Elements of a Swimlane Diagram
- Activities: Tasks or actions performed within the process.
- Swimlanes: Sections that categorize activities by participant or role.
- Arrows: Indicate the flow of the process.
- Decision Points: Points where a decision must be made, leading to different paths in the diagram.
ATM Case Overview
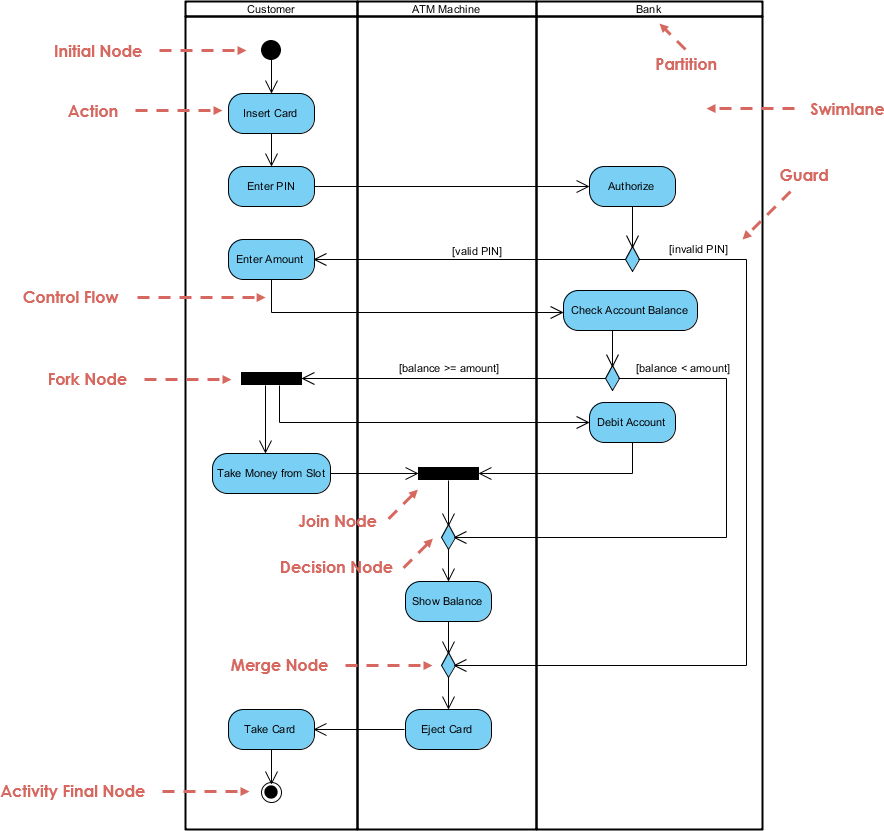
This case study analyzes the ATM transaction process as depicted in the swim lane activity diagram. The diagram illustrates the interaction between three primary entities: the Customer, the ATM Machine, and the Bank. Each entity has its own “swim lane,” which helps clarify responsibilities and the flow of activities during a typical ATM transaction.

Components of the Diagram
- Initial Node: Represents the starting point of the process where the customer initiates the transaction.
- Swim Lanes:
- Customer Lane: Activities performed by the customer.
- ATM Machine Lane: Activities managed by the ATM.
- Bank Lane: Processes that involve bank interactions.
- Control Flow: Arrows indicate the flow of the process, showing the direction of activities.
- Fork Flow: Represents a decision point where the process can split into multiple paths based on conditions (e.g., validating the PIN).
- Join Node: Merges multiple paths back into a single flow.
- Decision Node: Points where a decision is required, leading to different outcomes based on conditions (e.g., sufficient balance check).
- Final Node: Indicates the end of the process, concluding the transaction.
Process Flow
- Initialization:
- The customer approaches the ATM and inserts their card.
- Entering PIN:
- The customer enters their PIN. This step is critical for validating the customer’s identity.
- PIN Validation:
- The ATM communicates with the bank to verify the validity of the entered PIN.
- Decision Point: If the PIN is valid, the process continues; otherwise, the transaction is terminated.
- Balance Check:
- Upon successful PIN validation, the ATM checks the customer’s account balance with the bank.
- Decision Point: If the balance is sufficient, the process moves forward to the transaction. If not, the customer is notified.
- Transaction Execution:
- If the balance is sufficient, the customer specifies the amount they wish to withdraw.
- The ATM processes the transaction by debiting the specified amount from the customer’s account.
- Show Balance:
- After the transaction is completed, the ATM displays the updated account balance to the customer.
- Card Ejection:
- Finally, the ATM ejects the card, concluding the transaction.
Analysis of the Swim Lane Diagram
The swim lane diagram effectively organizes the complex interactions between the customer, ATM, and bank, making the process easy to understand. Each lane clearly delineates responsibilities, which aids in identifying potential areas for improvement or troubleshooting.
Key Benefits of Using Swim Lane Diagrams
- Clarity: The diagram provides a clear visual representation of roles and responsibilities.
- Efficiency Identification: By mapping out the process, stakeholders can identify bottlenecks or redundancies.
- Communication Tool: It serves as an excellent communication tool among developers, designers, and stakeholders involved in ATM system development.
- Training Aid: New employees can use the diagram as a training resource to understand the transaction process.
Conclusion
Swimlane activity diagrams are powerful tools for visualizing processes and clarifying roles and responsibilities. By organizing information in a structured manner, they enhance understanding and communication among stakeholders, aiding in process improvement and training efforts. The swim lane activity diagram for the ATM transaction process is an invaluable tool for visualizing and understanding the interactions between customers, ATMs, and banks. By clearly defining responsibilities and flow, it highlights areas for efficiency improvements and serves as a solid foundation for further analysis or redesign of the ATM transaction system.
Swimlane Activity Diagram Resource
-
- Activity Diagram Tutorial – Visual Paradigm
- Activity Diagram Example: Swimlane – Visual Paradigm Community Circle
- Online Swimlane Diagram Tool – Visual Paradigm
- Activity Diagram – Visual Paradigm Handbook
- How to Draw Activity Diagram? – Visual Paradigm User Guide
- ATM Activity Diagram with Swimlanes – Visual Paradigm
- What is Activity Diagram? – Visual Paradigm
- Understanding Activity Diagrams in UML: A Comprehensive Guide – Visual Paradigm Guides
