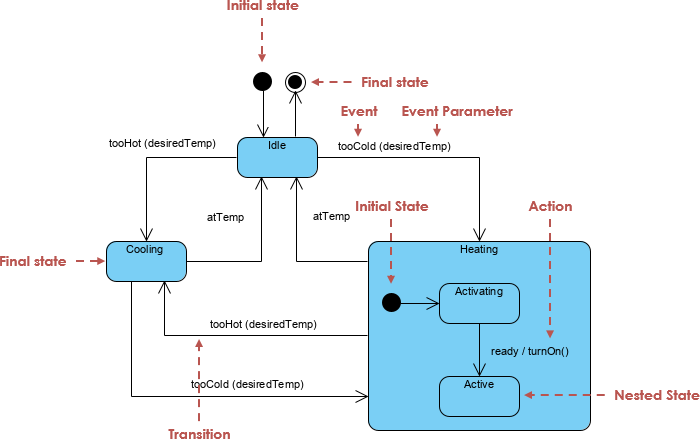
In this case study, we will explore a temperature control system using state diagrams. This tutorial will guide you through the components of the state diagram, illustrating how the system behaves based on temperature changes and control actions.
Overview of the Temperature Control System
The temperature control system is designed to maintain a desired temperature in an environment, such as a room or an industrial space. It consists of two main functions: heating and cooling. The system continuously monitors the current temperature and adjusts its state accordingly to maintain the desired temperature.

Components of the State Diagram
Let’s break down the state diagram into its key components:
1. States
The state diagram contains the following main states:
- Idle: The default state when the system is not actively heating or cooling.
- Cooling: The state where the system is actively cooling the environment.
- Heating: The state where the system is actively heating the environment.
- Activating: A substate indicating preparation for heating.
- Active: A substate indicating the system is heating.
2. Transitions
Transitions represent the movement between states based on events. Here are the transitions defined in the diagram:
- From Idle to Cooling: This transition occurs when the temperature is too hot.
- From Idle to Heating: This transition occurs when the temperature is too cold.
- From Cooling to Idle: The system returns to Idle when the temperature reaches the desired level (atTemp).
- From Heating to Idle: The system returns to Idle when the desired temperature is achieved.
3. Events and Parameters
Events trigger transitions between states. In our system, the events are driven by temperature readings:
- tooHot: Triggering event indicating the current temperature exceeds the desired level.
- tooCold: Triggering event indicating the current temperature is below the desired level.
- atTemp: Triggering event indicating the current temperature matches the desired level.
4. Initial and Final States
- Initial State: The system starts in an Idle state, ready to respond to temperature changes.
- Final State: The diagram doesn’t explicitly define a final state, as the system continually operates between Idle, Cooling, and Heating based on temperature fluctuations.
Step-by-Step Analysis of the State Diagram
Step 1: Starting in Idle
When the system is in the Idle state, it awaits temperature changes. At this point, the system is monitoring the temperature without taking any action.
Step 2: Responding to Temperature Changes
- If the temperature rises above the desired threshold (tooHot), the system transitions from Idle to Cooling.
- Conversely, if the temperature drops below the desired threshold (tooCold), the system transitions from Idle to Heating.
Step 3: Cooling Process
In the Cooling state, the system actively works to reduce the temperature. Once the current temperature aligns with the desired temperature (atTemp), the system transitions back to the Idle state.
Step 4: Heating Process
In the Heating state, the system can exist in two substates:
- Activating: The system prepares to heat the environment.
- Active: The system is actively heating the environment.
Once the desired temperature is reached (atTemp), the system transitions back to Idle.
Conclusion
The temperature control system state diagram effectively models the dynamic behavior of the system in response to temperature fluctuations. By analyzing the states, transitions, and events, we gain insights into how the system operates to maintain the desired temperature.
State Diagram Resources
- State Machine Diagram Tutorial – Visual Paradigm: This tutorial provides a comprehensive guide on creating state machine diagrams, including the basic components, transitions, and states.
- Mastering State Diagrams in UML: A Comprehensive Guide: This article covers the fundamentals of state diagrams, their components, and best practices. It also includes advanced concepts and common mistakes to avoid.
- How to Draw State Machine Diagram? – Visual Paradigm: This guide walks you through the steps to create a UML state machine diagram in Visual Paradigm, from selecting the diagram type to adding states and transitions.
- Applying State Diagrams: A Comprehensive Guide – Visual Paradigm Guides: This comprehensive guide explains how to apply state diagrams in various contexts, such as software development and business process management3.
